Salt Lake County Election Statistics
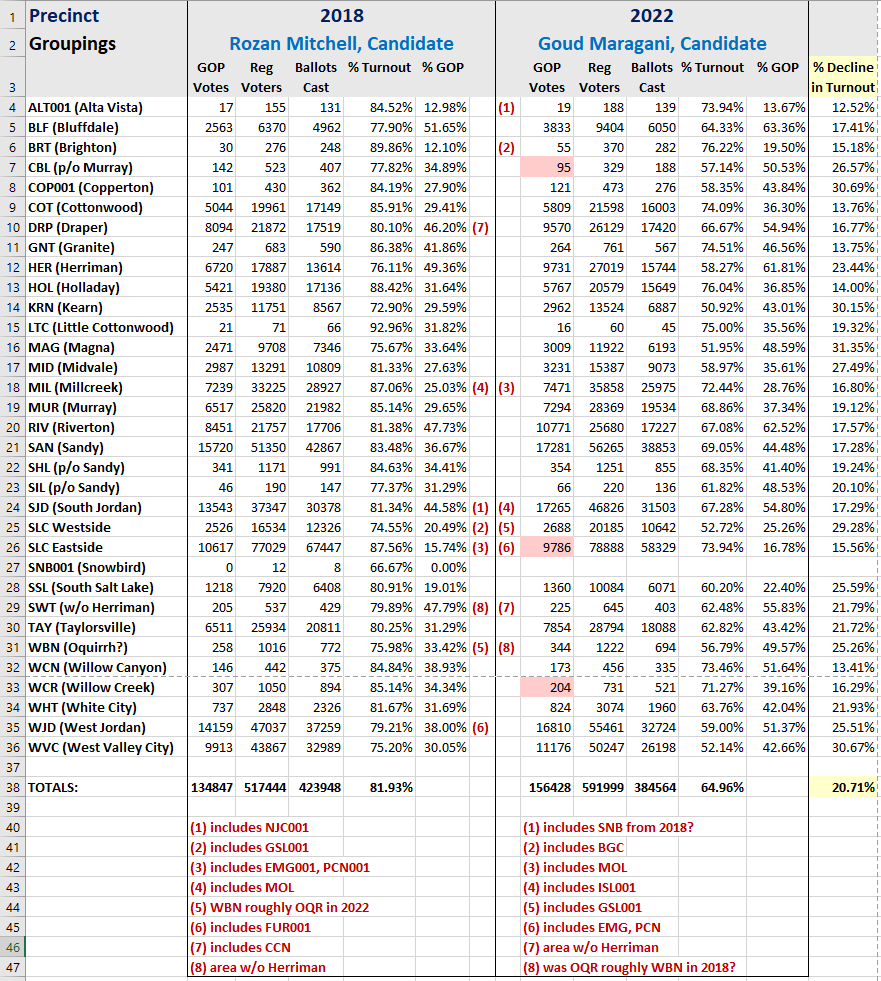
Salt Lake County 2018 and 2022 Clerk races compared by precinct grouping
See the explanation of precinct groupings under Turnout.
The boxes with red backgrounds mark those precinct groupings in which the 2022 candidate drew fewer votes in that precinct grouping than the 2018 candidate.
Despite the nearly 21% decline in voter turnout and other complications during the 2022 campaign, Goud Maragani, the 2022 GOP candidate, managed to achieve a 16% vote increase over the 2018 GOP candidate.
Download as PDF: 20182022SLCoClerkCompareData.pdf
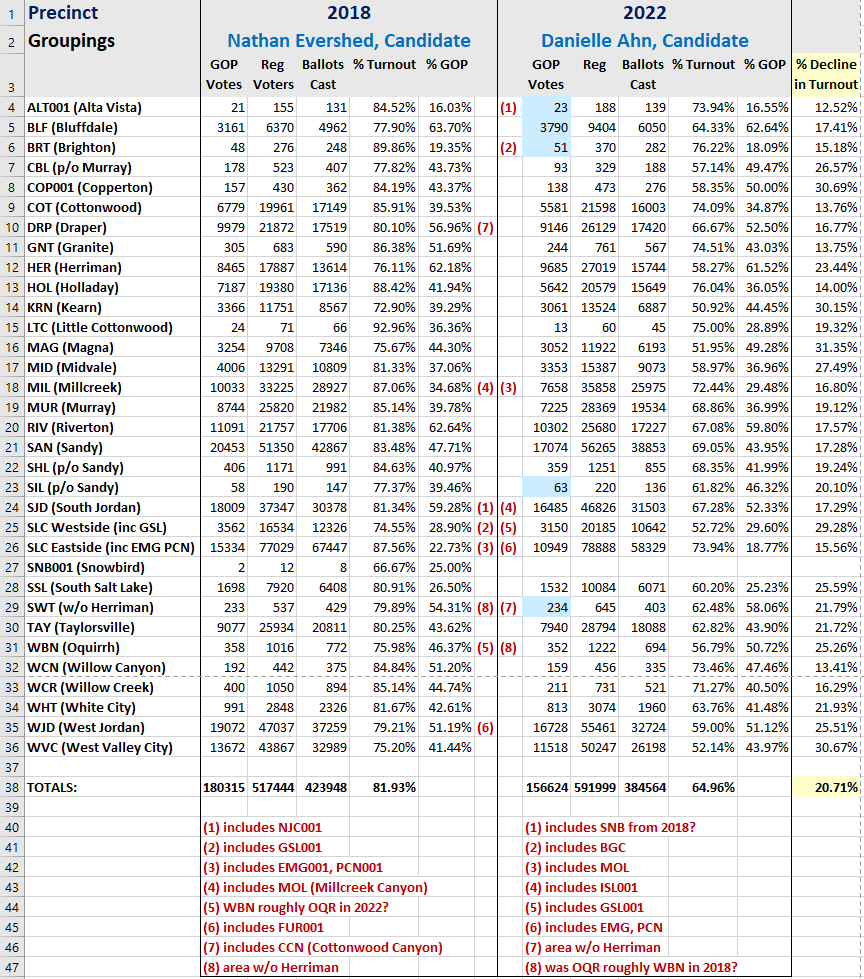
Salt Lake County 2018 and 2022 District Attorney races compared by precinct grouping
The boxes with light blue backgrounds mark those precinct groupings in which the 2022 candidate Danielle Ahn drew more votes in that precinct grouping than the 2018 candidate.
This race fought a bad headwind due to the nearly 21% decline in turnout over 2018. The 15% vote decline in the 2022 DA race indicates that some of the electorate didn't sink into that voter malaise and got out to cast their vote for Danielle.
Download as PDF: 20182022SLCoDistrictAttorneyCompareData.pdf
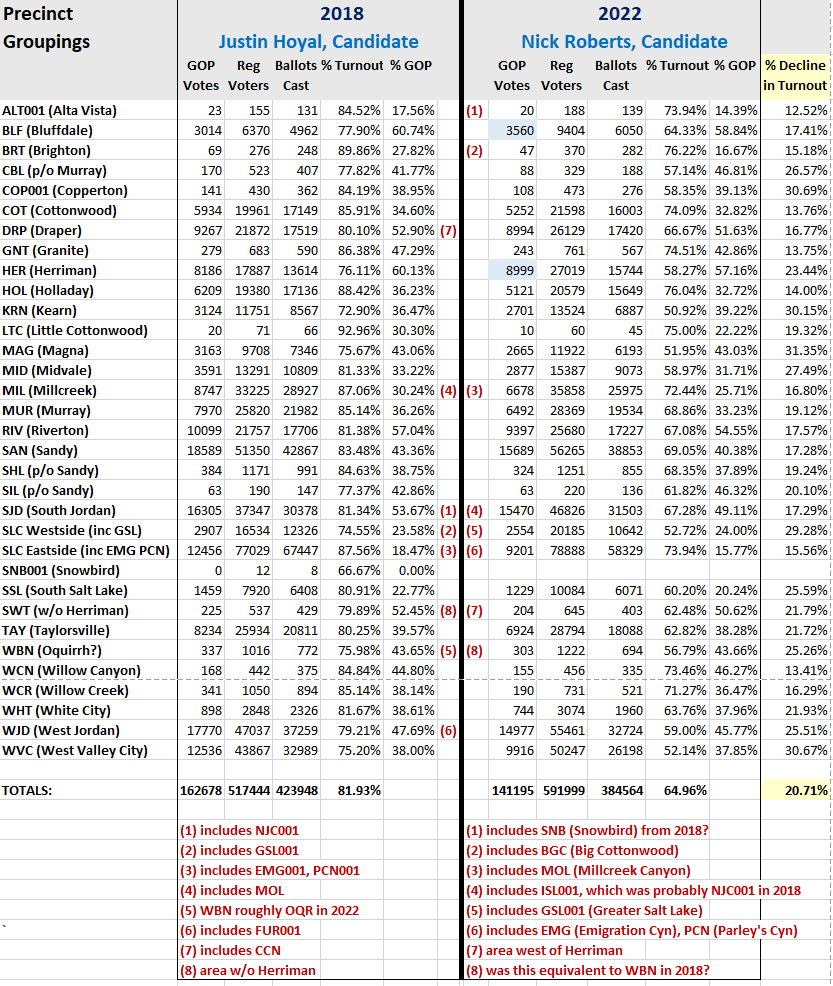
Salt Lake County 2018 and 2022 Sheriff races compared by precinct grouping
The boxes with light blue backgrounds mark those precinct groupings in which the 2022 candidate Nick Roberts drew more votes in that precinct grouping than the 2018 candidate.
This race fought a bad headwind due to the nearly 21% decline in turnout over 2018. The 13% vote decline in the 2022 Sheriff race indicates that some of the electorate didn't sink into that voter malaise and got out to cast their vote for Nick.
Download as PDF: 20182022SLCoSheriffCompareData.pdf