Page last updated: Wednesday, 01-Mar-2023 06:25:23 EST
Salt Lake County Election Statistics
Salt Lake County Historical Data for Clerk, District Attorney, Sheriff Races
Download as PDF: SLCoThreeRacesCombined.pdf
Data fields for the 2014, 2018 and 2022 Salt Lake County races for Clerk, District Attorney, and Sheriff are as follows:
| Ballots Cast | Ballots cast for an election according to county clerk or state data (does not mean they were all readable, or that a vote was cast in a specific race). |
| NVBM | Voting in-person, meaning using machine at the county clerk office or at a voting center. |
| VBM | Absentee / Vote By Mail (includes dropping mail-in ballot into a dropbox or leaving mail-in ballot at Voting Center. |
| % NVBM | Percent of ballots a candidate received by NVBM in a race. |
| % VBM | Percent of ballots a candidate received by VBM in a race. |
| % Cast for race NVBM | Percentage of ballots cast in a race by NVBM. |
| % Cast for race VBM | Percentage of ballots cast in a race by VBM. |
| % Turnout | Ballots cast / (divided by) registered voters. |
| % Not Counted | (Ballots Cast – Total Votes for race) / (divided by) Ballots Cast expressed as a percentage. |
| Σ | Mathematical summation. |
Table Key
2014, 2018, 2022 Data
The data shows that these three key positions – Clerk, District Attorney, and Sheriff – have not been held by the GOP in over a decade. With the exception of the Clerk race in 2022, conservatives have lost ground as a percentage of votes won. 2022 showed a plunge in turnout, so to actually gain ground, as in the Clerk race, is remarkable.
How do we reverse the turnout trend and how do we get good people elected?
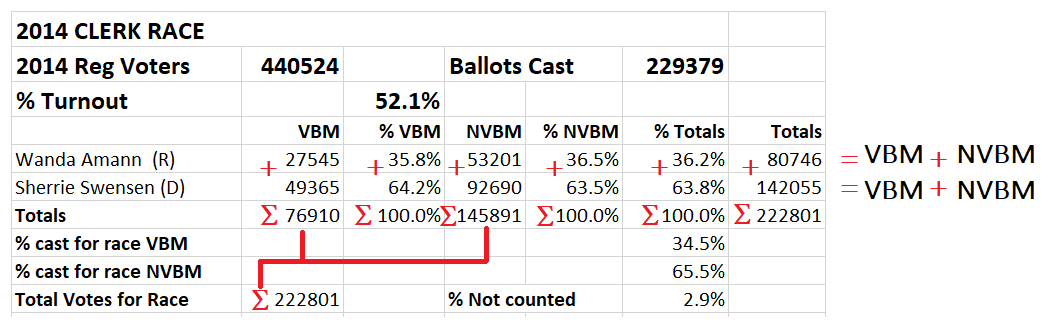
Clerk Races
2014 CLERK RACE 2014 Reg Voters 440524 Ballots Cast 229379 % Turnout 52.1% VBM % VBM NVBM % NVBM % Totals TotalsWanda Amann (R) 27545 35.8% 53201 36.5% 36.2% 80746 Sherrie Swensen (D) 49365 64.2% 92690 63.5% 63.8% 142055 Totals 76910 100.0% 145891 100.0% 100.0% 222801 % cast for race VBM 34.5% % cast for race NVBM 65.5% Total Votes for Race 222801 % Not counted 2.9%2018 CLERK RACE 2018 Reg Voters 517444 Ballots Cast 423948 % Turnout 81.9% VBM % VBM NVBM % NVBM % Totals TotalsRozan Mitchell (R) 118357 33.6% 16490 34.2% 33.7% 134847 Sherrie Swensen (D) 233908 66.4% 31770 65.8% 66.3% 265678 Totals 352265 100.0% 48260 100.0% 100.0% 400525 % cast for race VBM 88.0% % cast for race NVBM 12.0% Total Votes for Race 400525 % Not counted 5.5%2022 CLERK RACE 2022 Reg Voters 591999 Ballots Cast 384564 % Turnout 65.0% VBM % VBM NVBM % NVBM % Totals TotalsGoud Maragani (R) 139761 41.6% 16667 59.6% 42.9% 156428 Lannie Chapman (D) 196247 58.4% 12497 40.4% 57.1% 208744 Totals 336008 100.0% 29164 100.0% 100.0% 365172 % cast for race VBM 92.0% % cast for race NVBM 8.0% Total Votes for Race 365172 % Not counted 5.0%
District Attorney Races
2014 DISTRICT ATTORNEY RACE 2014 Reg Voters 440524 Ballots Cast 229379 % Turnout 52.1% VBM % VBM NVBM % NVBM % Totals TotalsSteve Nelson (R) 38702 50.0% 70954 48.2% 48.8% 109656 Sim Gill (D) 38677 50.0% 76238 51.8% 51.2% 114915 Totals 77379 100.0% 147192 100.00% 100.0% 224571 % cast for race VBM 34.5% % cast for race NVBM 65.5% Total Votes for Race 224571 % Not counted 2.1%2018 DISTRICT ATTORNEY RACE 2018 Reg Voters 517444 Ballots Cast 423948 % Turnout 81.9% VBM % VBM NVBM % NVBM % Totals TotalsNathan Evershed (R) 160679 44.9% 19636 40.3% 44.3% 180315 Sim Gill (D) 197519 55.1% 29035 59.7% 55.7% 226554 Totals 358198 100.0% 48671 100.0% 100.0% 406869 % cast for race VBM 88.0% % cast for race NVBM 12.0% Total Votes for Race 406869 % Not counted 4.0%2022 DISTRICT ATTORNEY RACE 2022 Reg Voters 591999 Ballots Cast 384564 % Turnout 65.0% VBM % VBM NVBM % NVBM % Totals TotalsDanielle Ahn (R) 139806 40.9% 16818 57.1% 42.14% 156624 Sim Gill (D) 202400 59.1% 12615 42.9% 57.80% 215015 Totals 342206 100.0% 29433 100.0% 99.94% 371639 Error of .06% % cast for race VBM 92.1% % cast for race NVBM 7.9% Total Votes for Race 371639 % Not counted 3.4%
Sheriff Races
2014 SHERIFF RACE 2014 Reg Voters 440524 Ballots Cast 229379 % Turnout 52.1% VBM % VBM NVBM % NVBM % Totals TotalsJake Petersen (R) 30506 39.4% 59315 40.3% 40.0% 89821 James Winder (D) 46835 60.6% 87831 59.7% 60.0% 134666 Totals 77341 100.0% 147146 100.0% 100.0% 224487 % cast for race VBM 34.5% % cast for race NVBM 65.5% Total Votes for Race 224487 % Not counted 2.1%2018 SHERIFF RACE 2018 Reg Voters 517444 Ballots Cast 423948 % Turnout 81.9% VBM % VBM NVBM % NVBM % Totals TotalsJustin Hoyal (R) 144542 40.8% 18136 37.2% 40.4% 162678 Rosie Rivera (D) 209609 59.2% 30647 62.8% 59.6% 240256 Totals 354151 100.0% 48783 100.0% 100.0% 402934 % cast for race VBM 87.9% % cast for race NVBM 12.1% Total Votes for Race 402934 % Not counted 5.0%2022 SHERIFF RACE 2022 Reg Voters 591999 Ballots Cast 384564 % Turnout 65.0% VBM % VBM NVBM % NVBM % Totals TotalsNick Roberts (R) 125256 36.7% 15939 56.4% 38.1% 141195 Rosie Rivera (D) 216388 63.3% 13540 43.6% 61.9% 229928 Totals 341644 100.0% 29479 100.0% 100.0% 371123 % cast for race VBM 92.1% % cast for race NVBM 7.9% Total Votes for Race 371123 % Not counted 3.5%